

Why PDR Market Estimates Range From $1.8 Billion to $8.9 Billion
Executive takeaway
Published estimates place the global 2025 PDR market between $1.8 billion and $8.9 billion. That spread warrants checking definitions before using forecasts to justify expansion. One report combines repair labor with tools and kits; other boundaries remain less clear. Duplicate listings also overstate apparent corroboration. Five estimates cluster around $1.8–3.9 billion, providing a provisional reference—not a verified service-only total. Check scope, measurement year, methodology, and research independence before using any figure in a business plan.
Before you trust the headline, check what it measures
Published estimates disagree sharply about the global 2025 paintless dent repair (PDR) market. MarketIntelo’s PDR report puts it at $1.8 billion, covering dent removal without repainting.
Deep Market Insights’ service report puts the market at $8.9 billion. Dividing $8.9 billion by $1.8 billion gives a 4.9-fold gap: almost five times the estimated revenue.
That difference matters when research informs expansion plans, franchise evaluations, or insurer discussions. A larger headline could suggest substantially more room for growth. This is a potential decision risk, not evidence that reliance on either estimate caused losses.
The first question is not which number looks most attractive. It is which figure measures the business a PDR operator runs. Similar report titles do not establish that publishers counted the same transactions.
For service operators, the key distinction separates revenue from repairing vehicles and revenue from selling equipment. Both belong to the broader PDR economy, but they describe different activities. A combined total cannot automatically benchmark a repair shop’s service revenue.
The supplied evidence identifies Dataintelo’s estimate as including technician labor, tools, and DIY kits. This broader coverage creates a documented comparability problem. Other differences remain unresolved because the underlying methods were unavailable.
Repeated listings create a separate problem: apparent corroboration without additional evidence. The inventory below counts repeated figures once, while distinguishing report providers from distributors. That removes obvious duplication, but does not prove research independence.
The central argument is therefore narrower than a complete explanation of the $7.1 billion difference. Scope must be reconciled before these estimates can support a common market claim. The evidence does not establish how much of the spread comes from definitions, methods, or other assumptions.
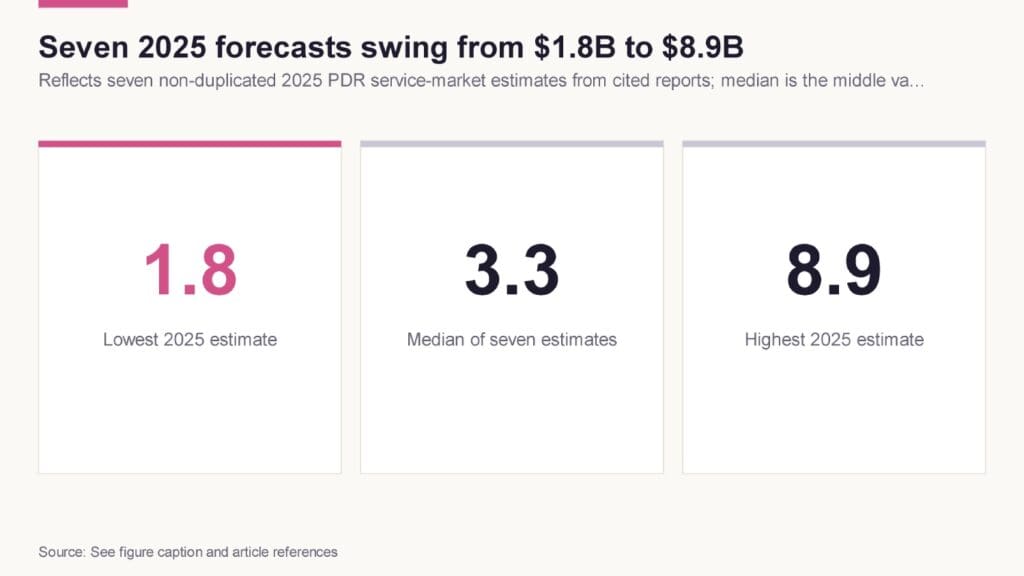
The gap between the lowest and highest 2025 PDR market estimates is nearly five-fold, even though both describe the same labeled category. Method: Low and high values taken directly from cited reports; median calculated by the author from seven non-duplicated 2025 figures identified across sources.
Meet the seven estimates, not seven established facts
The seven figures below are distinct reported estimates for 2025, not seven verified measurements of an identical market. This inventory uses the supplied report summaries and source metadata; it does not audit the underlying research. Repeated listings count once.
- MarketIntelo: $1.8 billion. MarketIntelo’s PDR market report supplies the smallest estimate. The supplied evidence identifies a second services title carrying the same figure. Those listings provide one numerical entry, not two independent confirmations.
- IRES, distributed through GiiResearch: $2.03 billion. The PDR service market listing attributes the research to IRES. GiiResearch distributes it. For an explicitly earlier-year comparison, the reported 2024 value is $1.89 billion; that figure is excluded from this inventory.
- WiseGuy Reports: $2.55 billion. The WiseGuy service report provides the third-smallest 2025 estimate. Its 2024 baseline, included only for comparison, is $2.38 billion. The supplied material identifies no separate research provider.
- Growth Market Reports: $3.33 billion. The Growth Market Reports estimate occupies the middle position. Its breakdown assigns passenger cars 64.5% of demand. That segmentation describes the report’s categories; it does not validate its total.
- PMarketResearch: $3.85 billion. The PMarketResearch service estimate divides revenue across five regions. According to the supplied summary, those figures sum exactly to the headline amount. This shows internal arithmetic consistency, not external confirmation.
- Dataintelo: $7.0 billion. The Dataintelo report includes tools and DIY kits alongside technician labor. Its scope is therefore broader than a labor-only estimate. A direct comparison requires a separate equipment breakdown, which the available evidence does not provide.
- Deep Market Insights: $8.9 billion. The Deep Market Insights report supplies the largest estimate. Its report page and table-of-contents page represent the same research product. The evidence does not establish whether its boundary matches Dataintelo’s equipment-inclusive definition.
Publication dates and measurement years must remain separate. Supplied metadata dates the PMarketResearch publication to June 24, 2026, and WiseGuy Reports to August 27, 2026. Both report 2025 values in the supplied summaries. These metadata dates were not independently checked against full report histories.
This inventory establishes the claims requiring comparison. It does not establish a consensus, equivalent definitions, or seven independent evidential foundations.
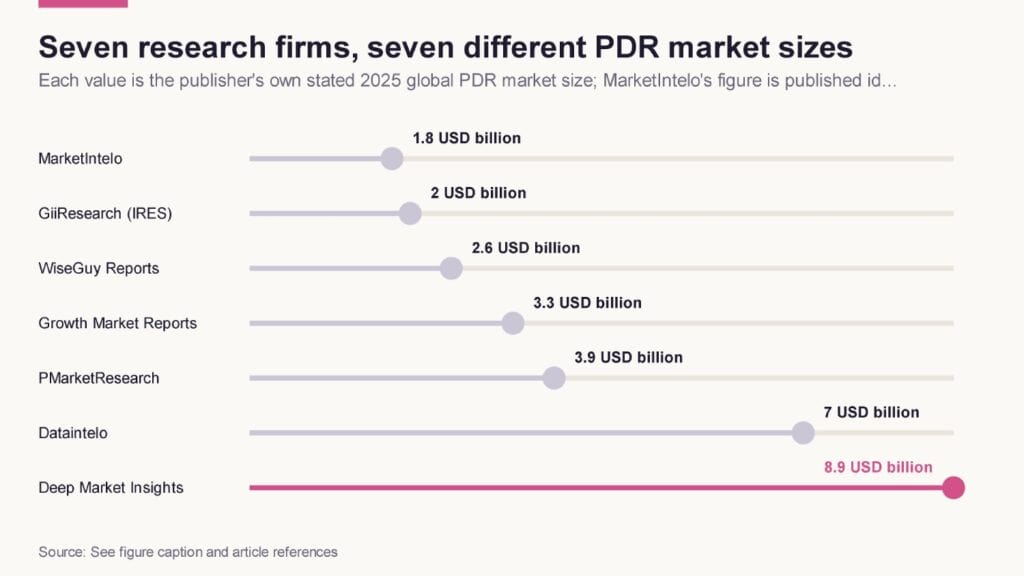
Ranking every 2025 PDR market estimate shows no two publishers agree within even $500 million of each other. Method: Values ranked ascending from the seven non-duplicated 2025 figures found in the supplied sources.
Repair labor and equipment sales are different businesses
Repair labor and equipment sales measure different activities, even when both appear under a PDR label. A technician earns revenue from repairs; a supplier earns revenue from products used to perform them.
The supplied summary describes MarketIntelo’s $1.8 billion services estimate as labor-only. On that interpretation, technician-billed repair work is the relevant comparison—not every purchase associated with providing it.
By contrast, the supplied evidence describes Dataintelo’s $7.0 billion estimate as including labor plus rods, lights, glue-pull systems, and DIY kits at first sale. That transaction-stage qualification matters, but it does not make equipment sales equivalent to repair labor.
For a service-only shop, equipment purchases are costs rather than customer repair revenue. A supplier’s light sale and a technician’s repair invoice are separate transactions. Counting both can describe broader commercial activity, but not a labor-only revenue opportunity.
This distinction establishes noncomparability, not the size of its effect. Without Dataintelo’s equipment component, subtracting product sales would require an unsupported assumption. The evidence also does not establish the same equipment-inclusive boundary for Deep Market Insights. Its larger headline alone cannot reveal what it counts.
Segment comparisons introduce another problem: reports divide revenue along different dimensions. PMarketResearch assigns 45% of revenue to individual vehicle owners within its $3.85 billion total. This classification concerns the customer.
Deep Market Insights identifies a 36% hail-related segment and emphasizes hail-driven insurance claims. Hail describes damage, while insurance involvement concerns claims or payment. Neither category directly matches an individual-owner classification.
An individual owner could also need hail repairs. These shares therefore cannot be added or treated as competing measurements of the same segment. Nor does either share explain why the publishers’ overall totals differ.
Operators should match estimates to their own revenue categories:
- Repair services: Compare technician-billed work with repair-service revenue estimates.
- Equipment sales: Separate rods, lights, and glue-pull systems from repair invoices.
- DIY kits: Treat kit sales as product revenue, not professional repair labor.
- Mixed operations: Separate service and product revenue before considering a combined benchmark.
A broader definition may suit a business selling both repairs and equipment. It should not become a service-only shop’s estimate of additional demand for technician time.
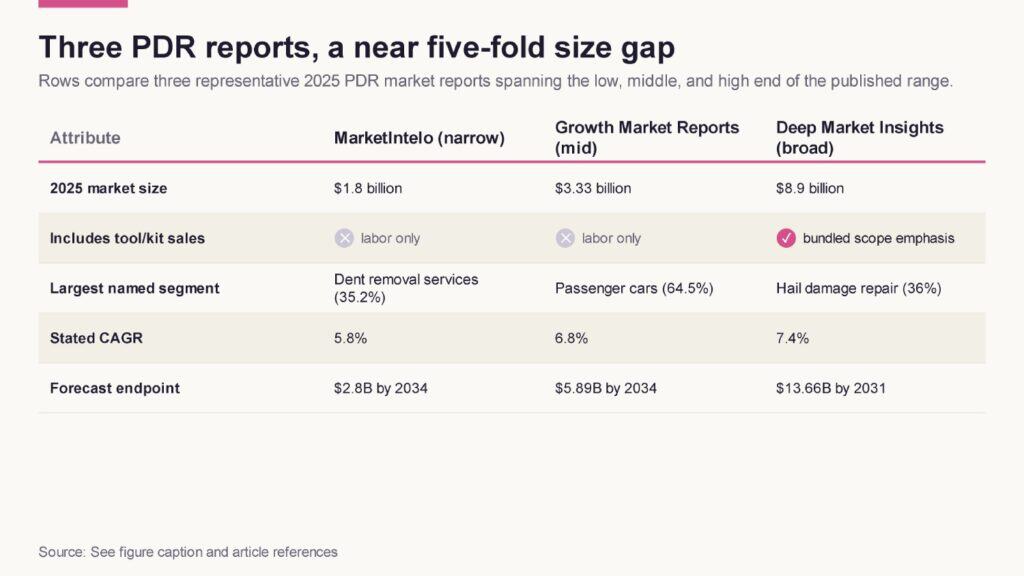
Three reports labeled ‘PDR market’ describe three different scopes of revenue, not three views of the same data. Method: Cells drawn verbatim from each report’s stated figures and segment leaders; CAGR and forecast endpoints taken directly from cited evidence.
Repeated numbers deserve a closer look
Repeated figures warrant investigation, not an automatic verdict on research quality. The supplied evidence identifies the same 5.8% compound annual growth rate across four MarketIntelo categories: mobile paint repair services, PDR kits, PDR, and PDR services.
A compound annual growth rate, or CAGR, expresses the constant yearly rate connecting starting and ending values. It summarizes growth across a period; it does not mean actual annual growth follows that smooth path.
The pattern extends from mobile paint repair services to categories with different commercial boundaries. Equipment sales and repair labor need not grow identically. However, common drivers, rounding, or shared assumptions could produce matching published rates.
The same rate also appears in MarketIntelo’s kits report. The evidence does not reveal the internal calculations or establish why the forecasts match. Neither templated production nor inaccurate research has been proven.
The relevant question is how much independent support these forecasts provide. Several outputs from one model would not equal several independently derived measurements. Yet shared modeling remains a possible explanation here, not a verified finding.
Duplicate access pages pose a clearer issue. Deep Market Insights’ separate table-of-contents page repeats the $8.9 billion figure for the same report and base year. Another URL adds access, not another research result.
Three distinctions keep these issues separate:
- Repeated publication: The same research appears in multiple places.
- Shared modeling: Different estimates use common assumptions or methods.
- Independent corroboration: Separate evidence supports a similar conclusion.
The first is documented for the duplicate listings. The second requires methodological evidence unavailable here. The third cannot be inferred from matching numbers alone. Count underlying research products first, then investigate whether their data and assumptions are genuinely separate.
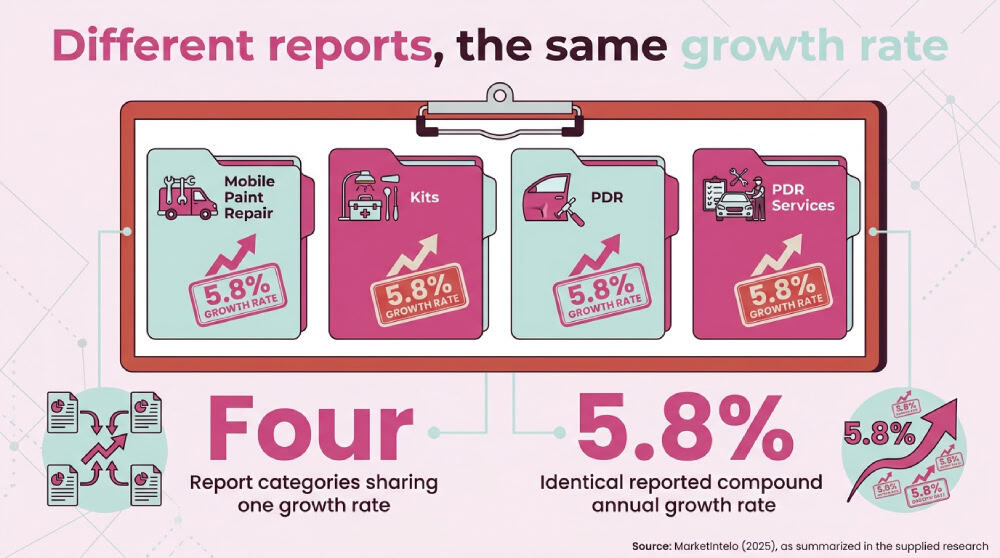
Source: MarketIntelo (2025), as summarized in the supplied research
The body-repair cross-check raises another question
The broader body-repair market raises another boundary question rather than resolving PDR market size. Dataintelo’s car body repair report assigns the global category $212.5 billion in 2025, with PDR accounting for 24.2%.
Applying that share produces $51.4 billion: $212.5 billion multiplied by 24.2% equals $51.425 billion, rounded. The supplied summary says this matches the report’s stated segment estimate. It remains a value within a broader classification framework, not an independently comparable standalone PDR estimate.
The discrepancy is especially notable because Dataintelo also supplies the dedicated $7.0 billion PDR estimate. Reconciling these figures requires the parent market’s boundaries and revenue-allocation rules. Correct arithmetic cannot establish whether both reports count the same transactions.
Broader collision-repair estimates provide a contrasting pattern. Metastat Insight values global automotive collision repair at $204.3 billion for 2025. That is near Dataintelo’s body-repair total, although the category labels are not interchangeable without further evidence.
Polaris Market Research estimates global automotive collision repair at $208.12 billion for 2025. Relative to Metastat’s figure, the calculated difference is approximately 1.9%: ($208.12 billion − $204.3 billion) ÷ $204.3 billion × 100.
These two totals agree much more closely than the PDR headlines. Their agreement does not establish standardized definitions, accurate measurement, or independent research. It also cannot explain disagreement in a different category.
Mobile paint repair shows that a specific-sounding label offers no guarantee of numerical agreement. MarketIntelo estimates that global market at $7.2 billion in 2025.
Dataintelo reports $18.5 billion for the same year. Dividing $18.5 billion by $7.2 billion gives approximately 2.57 times. The matching category label does not establish matching scope or methods.
Together, these comparisons show why both agreement and disagreement need interpretation. Different definitions are a plausible explanation for the spread, but their contribution remains unquantified. The body-repair cross-check identifies unresolved classifications; it does not reveal additional PDR revenue available to local shops.
Why the kit market looks easier to compare
The two 2025 PDR kit estimates are unusually close: $1.20 billion and $1.21 billion. They offer a tighter numerical comparison, not proof of accurate or independent measurement.
MarketIntelo’s kits report values the global market at $1.20 billion in 2025. Its product-focused label provides a more specific starting point than an undefined PDR market total.
The GiiResearch listing, citing The Business Research Company, reports $1.21 billion for 2025. The difference is $0.01 billion, or $10 million.
Using $1.20 billion as the denominator gives 0.83%: ($1.21 billion − $1.20 billion) ÷ $1.20 billion × 100. This measures disagreement between the published values, not their accuracy or statistical uncertainty.
A physical-product boundary may help explain the closer agreement. Products can potentially be described and counted more consistently than broadly defined service activity. But the supplied evidence does not demonstrate that mechanism or establish identical product coverage.
A sound comparison would check whether each report counts complete kits, individual components, or both. It would also distinguish manufacturer revenue from final customer spending. These are unresolved questions, not confirmed differences between the reports.
The matching $1.31 billion values concern 2026, not 2025. Both the GiiResearch listing and the ResearchAndMarkets listing report that later-year figure. They may distribute shared underlying research, so agreement should prompt a provider-and-title check rather than count automatically as corroboration.
A separately named tools category reinforces the need to inspect boundaries. Verified Market Research values automotive paintless dent removal tools at $3.23 billion in 2025, substantially above either kit estimate.
The evidence does not establish whether kits sit within that tools category, overlap with it, or follow different inclusion rules. Do not add the kits and tools totals without resolving overlap. Close agreement within the kit estimates does not validate a combined equipment-market total.
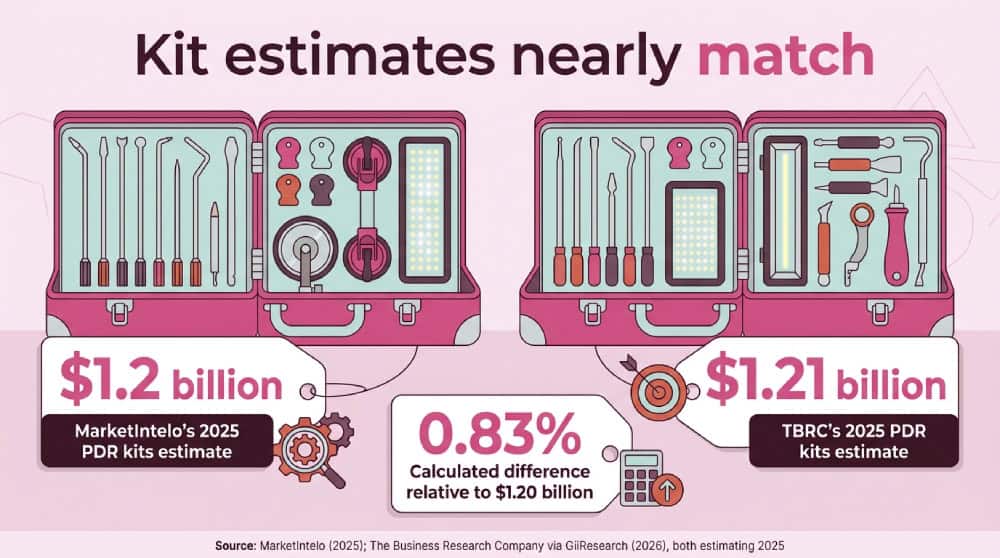
Source: MarketIntelo (2025); The Business Research Company via GiiResearch (2026), both estimating 2025
A forecast cannot fix an unclear starting point
A forecast cannot resolve uncertainty about the market’s starting size. Comparisons first need matching measurement years, clear market boundaries, and identified forecast periods.
The ResearchAndMarkets service listing reports $2.17 billion for 2026, not 2025. It belongs outside the seven-estimate inventory unless explicitly presented as a later-year comparison.
Moving that value backward would require an applicable growth assumption. Dividing $2.17 billion by one plus an annual rate would produce an implied 2025 value. That would be a modeled comparison, not an observed result. The supplied evidence provides no applicable rate, so no numerical adjustment is justified.
The MarketPublishers forecast presents a different limitation: $5.29 billion by 2032, without a clear 2025 baseline in the available material. Its endpoint cannot establish expected growth from 2025.
Nor does a future projection below another publisher’s current estimate necessarily predict contraction. The reports may describe different scopes or use incompatible starting assumptions. Comparing their endpoints without reconciling those differences would create a misleading growth narrative.
Three quantities must remain distinct:
- Starting estimate: Market value assigned to a specified reference year.
- Forecast endpoint: Projected value at the end of the stated period.
- CAGR: The constant annualized rate mathematically connecting those values.
A longer horizon can accumulate more total growth without assuming a faster annual rate. CAGR helps compare annualized growth, but cannot make differently defined markets equivalent.
The proposed widening-gap figure also needs an evidence check. No paired forecast series in the supplied material demonstrates that the gaps widen over time. Neither its title nor the available starting estimates can substitute for missing projected values.
A defensible figure would require each report’s starting value, projected values, corresponding years, and scope. It must also distinguish a widening dollar gap from a widening proportional gap. Those measures can behave differently.
Without those data, the widening-gap figure should be withheld. The evidence establishes disagreement among starting estimates, not increasing disagreement over time. Extending a forecast adds assumptions; it does not validate the market being forecast.
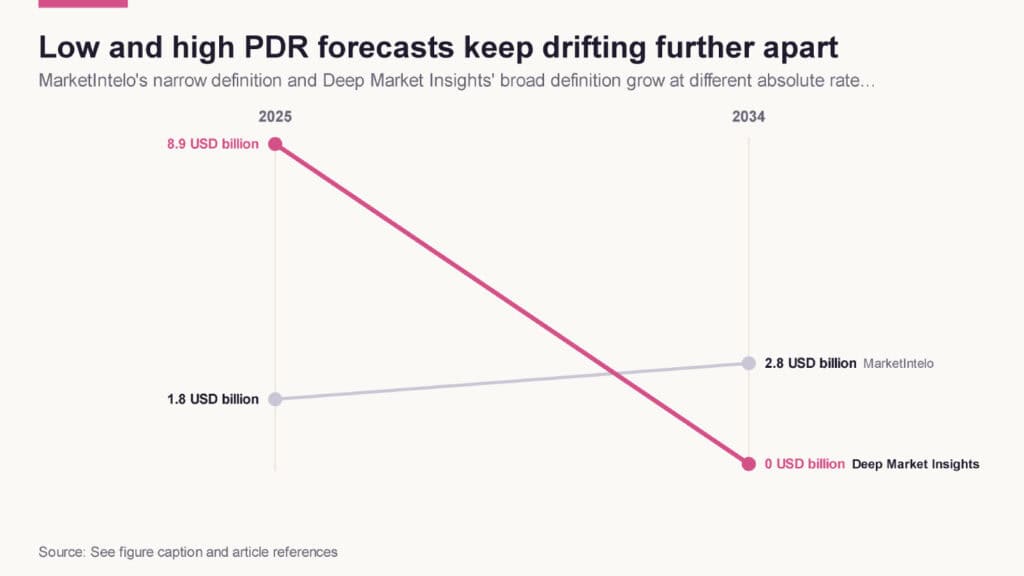
The narrow and broad definitions of the PDR market do not just start far apart — they grow further apart in absolute dollar terms. Method: Start and end values taken directly from each report’s stated 2025 baseline and forecast-year endpoint.
Use a planning range, not a false point estimate
Use a provisional reference range, not a single supposedly definitive estimate. The seven reported 2025 figures span incompatible or incompletely documented boundaries. Their arithmetic describes the published claims, not the true market.
Ordered from smallest to largest, the estimates are $1.80 billion, $2.03 billion, $2.55 billion, $3.33 billion, $3.85 billion, $7.00 billion, and $8.90 billion. Their sum is $29.46 billion.
- Median: $3.33 billion. This is the fourth ordered value, matching the Growth Market Reports estimate.
- Mean: approximately $4.21 billion. This is $29.46 billion divided by seven.
The mean exceeds the median by approximately $0.88 billion because the largest values pull it upward. Together, $7.00 billion and $8.90 billion contribute $15.90 billion, about 54% of the sum. That explains the arithmetic; it does not establish that either estimate is wrong.
The median is not validated merely because it is less sensitive to large values. Neither statistic reconciles market definitions or evaluates research quality. Both would also change if the selected report set changed.
The five lower estimates form a $1.80–$3.85 billion cluster, rounded to $1.8–$3.9 billion for provisional reference. Its upper endpoint comes from PMarketResearch. This is a descriptive grouping, not a statistically derived confidence interval.
Selecting that cluster is a transparent planning convention, not evidence that all five estimates measure technician labor. Their proximity does not establish matching definitions or independence. The larger estimates should not be dismissed solely because they lie outside it.
Place a scope note immediately beside any business-plan figure. For example:
Global PDR market reference, 2025: approximately $1.8–$3.9 billion, reflecting a five-report cluster. Definitions and research independence remain unresolved. This is not a verified labor-only total or a local demand forecast.
If a spreadsheet requires one number, label it a scenario assumption. Test whether the decision changes under alternative assumptions rather than hiding uncertainty behind decimal precision. Neither $3.33 billion nor $4.21 billion deserves automatic preference because it is easy to calculate.
Global totals cannot establish local addressable demand, technician utilization, or expansion returns. Those decisions require evidence about repair opportunities, achievable prices, referrals, competing capacity, and operating costs. The market range supplies context, not a forecast of profitable jobs for another technician or location.
Four questions to ask before using any market claim
Before using a PDR market claim, ask four questions. Comparability comes before calculation: averaging incompatible figures does not resolve their differences.
1. What revenue does the estimate count?
Establish whether the total covers technician labor, equipment sales, or both. The supplied evidence identifies Dataintelo’s PDR estimate as combining labor with tools and DIY kits at first sale.
Also check whether PDR is measured independently or allocated within a broader category. A share of body-repair revenue requires reconciliation before comparison with a dedicated PDR estimate. Match the boundary to the business activity being assessed.
2. Which year and geography does the figure describe?
Record the measurement year separately from publication date and forecast endpoint. A 2026 publication may report a 2025 value, while a 2026 market estimate describes a different observation.
Compare like years where possible. Label any growth-based adjustment as a calculation and retain its assumptions. Confirm geography too: a global total cannot establish the work a local shop could realistically compete to serve.
3. What methodology and assumptions does the publisher disclose?
Seek definitions, data inputs, sampling information, and revenue-calculation methods. Ask how the report handles equipment, insurance work, and overlapping categories. If those details are unavailable, retain that uncertainty rather than treating the title as sufficient documentation.
Repeated growth assumptions deserve scrutiny, but do not prove templated research. The four matching MarketIntelo rates illustrate a question to investigate, not a demonstrated methodological defect.
4. Is this genuinely distinct research?
Trace each figure to its original provider, report title, and measurement year. Count research products rather than webpages, storefront listings, or search results.
Deep Market Insights’ report and table-of-contents page represent one publication. Different providers also do not guarantee independent underlying data. Agreement becomes more informative when the evidential foundations are transparent.
For every retained estimate, record the value, scope, geography, year, original provider, and unresolved limitations together. Distinguish published claims from your calculations and planning assumptions.
These checks will not produce a verified market total from incomplete evidence. They will show which comparisons are defensible—and where global headlines must give way to local business evidence.
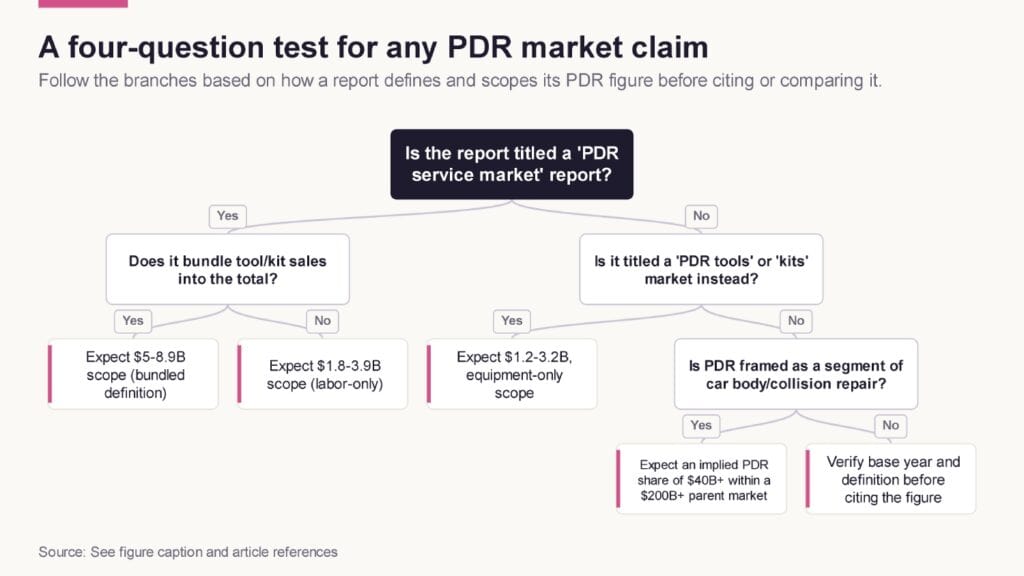
A practical decision guide for judging which PDR market figure applies to a given use case. Method: Decision logic synthesized from the definitional and scope differences identified across the cited 2025 PDR market reports.
Limitations
- The available evidence summarizes commercial reports and excerpts. Underlying datasets, full methods, and most complete reports were unavailable for verification.
- The evidence identifies equipment bundling in Dataintelo’s estimate, but not Deep Market Insights’ estimate. It cannot quantify how much scope differences explain the spread.
- Seven distinct estimates do not necessarily represent seven independent studies. Matching kit estimates may also reflect shared research.
- The mean, median, and five-report cluster describe only the selected estimates. They neither validate market size nor establish a service-only range.
- Publication dates, measurement years, and forecast periods differ. Supplied source metadata identifies some 2026 publications reporting 2025 values.
- No paired numerical forecast series supports the proposed figure showing widening future gaps.
References
- Paintless Dent Repair PDR Service Market
- Global Automotive Collision Repair Market
- Paintless Dent Repair Market Size, Share & Forecast …
- Top Companies Analysis
- Automotive Collision Repair Market Size, Growth Report, 2026-2034
- Paintless Dent Repair Kits Market Research Report 2034
- pdf.marketpublishers.com · globalinfo · globalGlobal Paintless Dent Repair (PDR) Service Supply, Demand and …
- www.wiseguyreports.com · reports · paintless-dentPaintless Dent Repair PDR Service Market Growth Outlook 2035
- Paintless Dent Repair Service Market – Global Forecast …
- Paintless Dent Repair Kits Market Report 2026
- Paintless Dent Repair Service Market Forecast to 2031
- Paintless Dent Repair Market Report 2034
- Paintless Dent Repair Market Research Report 2034
- Paintless Dent Repair Kits Global Market Report 2026
- Car Body Repair Market Size, Share & Forecast Report 2025 to 2034 | Dataintelo
- Mobile Paint Repair Services Market Research Report 2034
- Paintless Dent Repair Services Market Research Report 2034
- Automotive Paintless Dent Removal Tools Market Report
- Paintless Dent Repair Service Market Forecast to 2031
- Paintless Dent Repair Service Market by Service Type, Vehicle …
About The Author